Solar power generation & sales

Photovoltaic potential in Canada
Canadian solar power generation in 2016 was almost 30 times that of solar power generation in 2010. Based on the current economic outlook, Canadian solar generation is expected to almost triple from 3.6 TW.h in 2016 to almost 13.0 TW.h by 2040. Over 98% of Canada’s solar power generation capacity is currently located in Ontario, which has offered incentives for renewable-energy projects. However, significantly decreasing solar PV module costs have made solar much more competitive. With lower costs and some proposed renewable-portfolio standards, it is expected that more generation will be installed in more locations throughout Canada, particularly those with high PV potential.
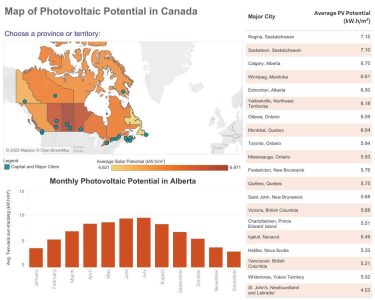
This map shows the annual average solar potential in each province and territory in Canada, as well as select cities. Saskatchewan has the highest potential with 6.79 kilowatt hours per square meter over a month (kW.h/m²). The remaining 12 provinces and territories, listed from greatest to least solar potential in kW.h/m², are: Manitoba (6.64), Alberta (6.58), Ontario (5.99), Quebec (5.83), Northwest Territories (5.79), New Brunswick (5.74), Nunavut (5.58), Prince Edward Island (5.54), British Columbia (5.50), Nova Scotia (5.37), Yukon Territory (5.10), and Newfoundland and Labrador (4.63). Capital and major cities are also included in the map. Of the major cities, Regina is exposed to the most photovoltaic potential (7.15), followed by: Saskatoon (7.10), Calgary (6.70), Winnipeg (6.61), Edmonton (6.50), Yellowknife (6.18), Ottawa (6.09), Montreal (6.04), Toronto (5.94), Mississauga (5.93), Fredericton (5.76), Québec (5.75), Saint John (5.68), Victoria (5.68), Charlottetown (5.51), Iqaluit (5.49), Halifax (5.33), Vancouver (5.21), Whitehorse (5.02) and St. John’s (4.53).
SOLAR SYSTEM SCENARIOS IN CANADA
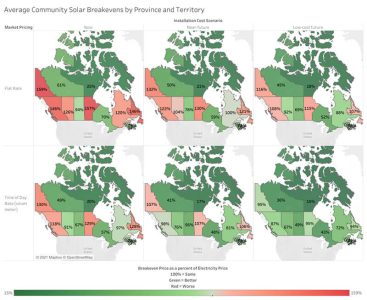
Scenario 3: Community-scale of 200 kW
to model medium-sized facilities providing power to a civic building, such as a recreation center. Importantly, the facility is assumed to be a non-profit, which has tax implications, and is the reason why community-scale is modeled separately from commercial-scale.
Reference
Download PDF files

